Overview:
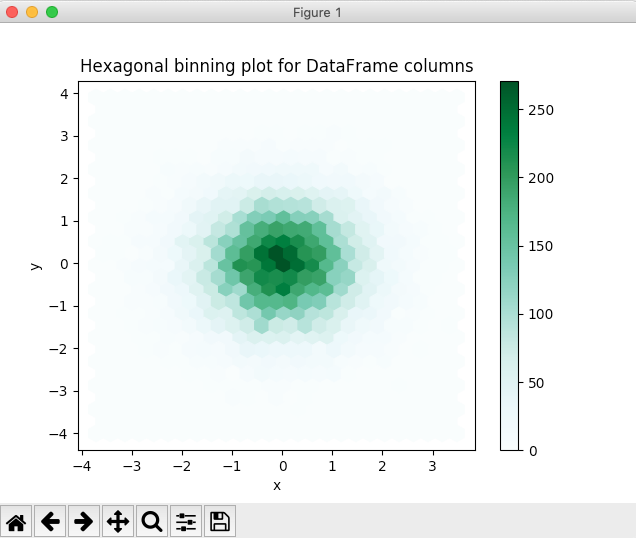
- A two-dimensional lattice is divided into a number of hexagonal grids of size (nxm).
- Based on the number of data points of the distributions of two variables x,y that fall under any hexagon, the hexagons are given a color ramp or given different sizes.
- A hexagonal binning plot is drawn when the number of points in the distribution is large.
Plotting a Hexagonal Binning Plot for a Pandas DataFrame:
- The method hexbin() of the plot member of a DataFrame instance draws a hexagonal binning plot for set of (x,y) points.
Example:
|
# Example python program to draw a Hexagonal Binning chart # for a pandas DataFrame import numpy as np import pandas as pd import matplotlib.pyplot as plot
# Generate two distributions of very large size distribution2d = np.random.randn(20000, 2); dataFrame = pd.DataFrame(data=distribution2d, columns=["x", "y"]);
# Draw a hexagonal binning chart dataFrame.plot.hexbin(x='x', y='y', gridsize=25, title="Hexagonal binning plot for DataFrame columns"); plot.show(block=True); |
Output:
